Node.js Observability & APM
Node.js traces break at every await. Alibaba's ARMS agent stitches them back
Node.js services now act as BFFs, gateways, and AI orchestration layers, so one request crosses databases, caches, queues, and LLM calls. Alibaba Cloud's ARMS Node.js agent merges OpenTelemetry tracing, runtime health checks, and AI observability into a single npm package.
Emmanuel Fabrice Omgbwa Yasse AI-assisted
2026-08-05 · 5 min read
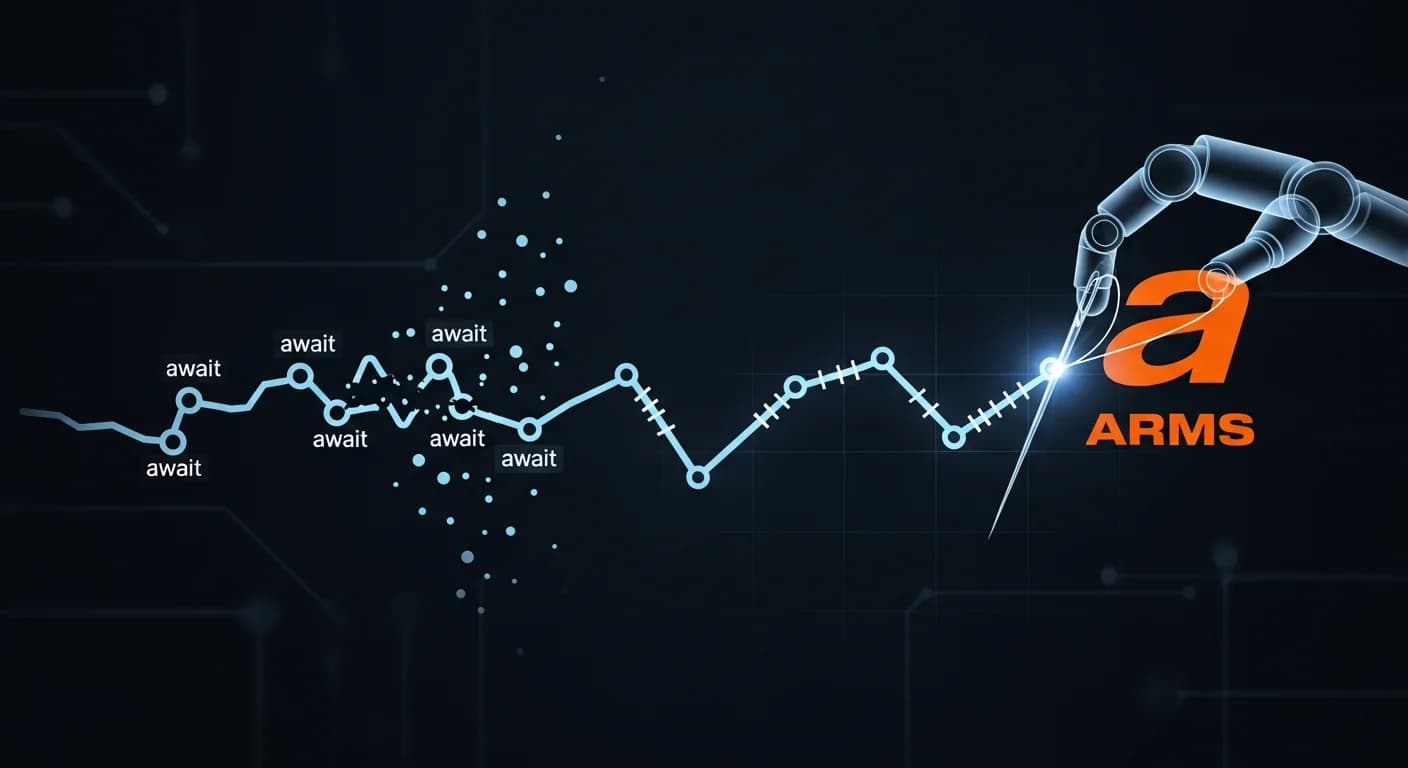
A user reports that "the AI assistant took forever to answer this time." The entry API shows a high response time. The database shows no slow SQL. Redis hit rate is normal. Logs are clean. That checklist used to close the case. In a Node.js service orchestrating AI agents, the explanation can hide anywhere: inside a LangChain tool call, in a spike of the model's time-to-first-token (TTFT), in a 200 millisecond block on the event loop, or in the router's choice of model, the blind spot TRACE-Router documents in agentic traces.
That scenario is why the Alibaba Cloud ARMS Node.js agent exists, and it goes after a problem APM tools were never built to solve. Node.js services no longer just receive requests, query databases, and return JSON. They act as backends for frontend (BFF), API gateways, real-time communication hubs, queue consumers, and AI agent orchestration layers. A single request can cross HTTP, databases, caches, RPCs, message queues, runtime resources, and LLMs. The shortage was never monitoring data. It is context.
The trace convergence problem
When Node.js sits between the user and every downstream dependency, a slow entry point reads as a Node.js problem even when the root cause lives in the database, the cache, a downstream RPC, or a model invocation. The runtime's own design makes correlation harder. Node.js is built around Promises, async/await, timers, callbacks, and the event loop, and each of those is a place where a trace ID can go missing. Once the ID is lost across an async boundary, the trace breaks into pieces, leaving only isolated spans and scattered logs. Rebuilding that story is still unsolved territory; on the AI side, AgentRCA's zero-shot root cause analysis is one attempt to close the gap.
Why runtime health shows up in API latency
A slow API is not always slow SQL. It can be an event loop blocked by synchronous work for 200 milliseconds, a V8 heap that keeps climbing until garbage collection jitters, abnormal CPU usage, or a process exhausting its resources. Classic API logs cannot answer whether the runtime itself is healthy. The agent collects runtime metrics through its MeterManager and reports them compressed with gzip and protobuf, so you can answer both which trace is slow and why the whole service is slow. The reported thread count is an estimate based on CPU cores and the libuv thread pool size, meant for trend observation, not exact values.
AI calls are a new observability target
Node.js is becoming the server-side layer for AI applications. Teams build intelligent customer service, coding assistants, data analysis agents, and internal productivity tools on the OpenAI SDK, LangChain.js, LangGraph, the Vercel AI SDK, and the Anthropic Claude SDK. The enterprise demand behind those frameworks is visible in Cognizant's push to train 30,000 staff on Claude. A request is now HTTP plus a database plus model invocations, orchestration, streaming, tool calls, embeddings, and RAG lookups.
Agent capability is uneven, and the 957,253-record Messier corpus is one measure of how uneven: function calling is nearly saturated while enterprise-grade tasks stall. The agent's built-in AI instrumentation covers those frameworks and enriches traces with GenAI semantics: model invocations, token usage, streaming responses, tool calls, and error details. The payoff is that nobody has to cross-reference model platform logs, business logs, and trace logs to answer one question about one user query.
One npm package, three integration paths
The package is @loongsuite/cms_node_sdk, where "cms" is a legacy naming convention; on the product side it functions as the ARMS Node.js agent. It is built on the core OpenTelemetry data model and wired end to end to ARMS. CommonJS projects preload it, ESM projects use a load hook, and projects wanting explicit control start the SDK in code:
# CommonJS: preload before the app starts
export ARMS_APP_NAME=your-app
export ARMS_REGION_ID=cn-hangzhou
export ARMS_LICENSE_KEY=your-license-key
node -r @loongsuite/cms_node_sdk/register app.js

# ESM: loader injection
node, experimental-loader=@loongsuite/cms_node_sdk/import-hooks app.mjs
const { NodeSDK } = require('@loongsuite/cms_node_sdk');
const sdk = new NodeSDK({
serviceName: 'your-app',
licenseKey: 'your-license-key',
regionId: 'cn-hangzhou',
workspace: 'your-workspace',
});
sdk.start();The ESM path uses import-in-the-middle for module interception, and the docs advise verifying the module loading sequence in a test environment if your project combines several loaders. The programmatic route must run before any business module is imported, or HTTP, database, and cache modules will not be instrumented. The agent also injects trace context into loggers such as Console, Pino, Winston, and Bunyan, so logs and traces query together.
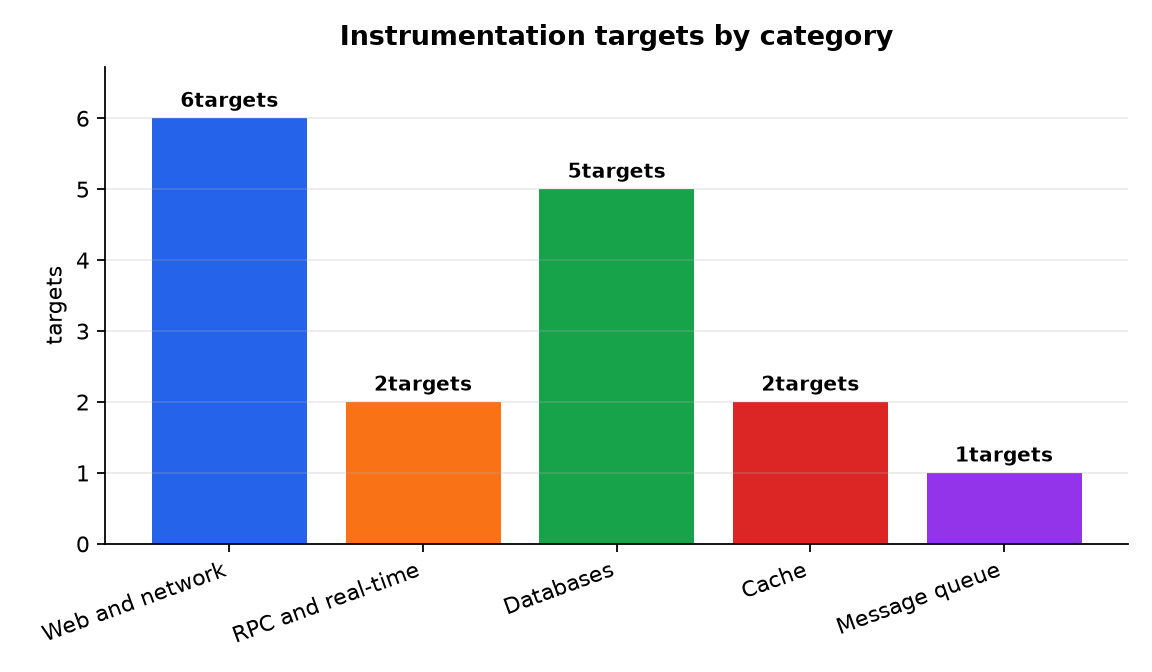
Context relies on AsyncLocalStorage by default, downgrading to AsyncHooks only on older runtimes, so spans survive Promises, callbacks, and timers. W3C Trace Context and Baggage propagation let a Node.js service join Java, Go, or Python services in one topology instead of standing alone. Built-in instrumentation covers the paths server-side Node.js work actually touches:
| Category | Supported targets |
|---|---|
| Web and network | HTTP/HTTPS, Express, Koa, Undici, Net, DNS |
| RPC and real-time | gRPC, Socket.IO |
| Databases | MySQL, MySQL2, PostgreSQL, MongoDB, Mongoose |
| Cache | Redis, ioredis |
| Message queue | Kafka |
The trade-off: building blocks vs a finished product
The clearest way to read this agent is as a product decision about OpenTelemetry. The open-source standard supplies the building blocks, but someone still has to choose an exporter, configure sampling, select plugins, standardize resource attributes, correlate logs, and solve AI observability. The ARMS agent answers those questions in advance and makes the answers changeable from a console: it pulls remote configuration about 60 seconds after startup and every 60 seconds after that, with no restart required. During traffic spikes you can lower the sampling rate, disable a plugin that clashes with a business library version, or raise sampling for a debugging session and revert it later.
Traditional APMs cover APIs and databases but often overlook AI calls; AI observability tools track prompts, tokens, and model traces but lack runtime metrics and core APM features. The ARMS agent is Alibaba Cloud's bet on having both in one package. Its design is deliberately low intrusion: batched export, compressed transport, sampling, plugin toggles, exception protection so instrumentation failures do not affect the business flow, and a clean shutdown that flushes buffered data on SIGINT and SIGTERM. Requirements are modest: Node.js 16.x or above, 18 or 20 LTS for production, and an ARMS LicenseKey and region ID.
The pitch is that Node.js observability should be as straightforward as installing an npm package. For teams already inside the Alibaba Cloud observability ecosystem, that is an out-of-the-box agent rather than a bundle of components to assemble. Whether teams running self-managed OpenTelemetry read an ARMS-bound agent as an upgrade or as lock-in is the question the vendor's own framing leaves open.
- Source : Node.js traces break at every await. Alibaba's ARMS agent stitches them back — 2024-08-14
Get the tech essentials in 3 minutes every morning
One email, every weekday, with what actually matters in AI and tech.